TL;DR
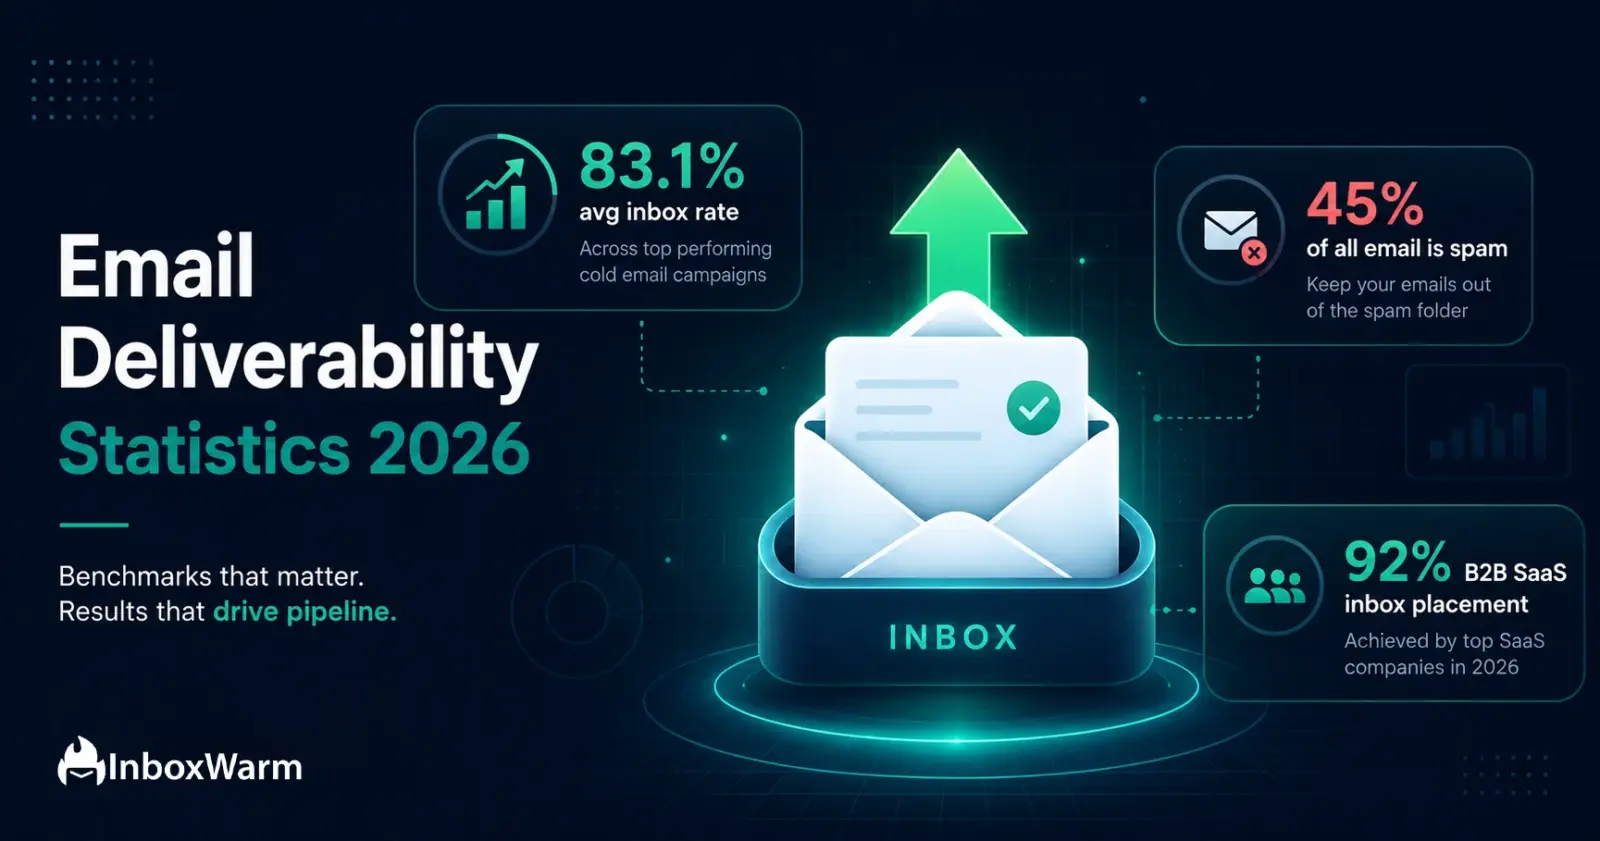
- The average email inbox placement rate in 2026 is 83.1%, meaning nearly 1 in 6 emails never reaches the inbox.
- Gmail leads all ESPs with ~95% deliverability; Outlook trails at 75.6%.
- Almost 45% of all global email traffic is spam, totaling roughly 188 billion junk emails per day.
- B2B SaaS senders achieve the highest inbox placement at 92%, while education ranks last at 86%.
- DMARC adoption is at 64%, but only 10.7% of domains enforce it at p=reject.
- SPF (93%) and DKIM (90%) are widely deployed, yet the global inbox rate still averages just 65% on some benchmarks.
- Email warm-up remains one of the most effective ways to protect and rebuild sender reputation in 2026.
If you are sending cold emails or running outbound campaigns in 2026, deliverability is no longer a background concern. It is the difference between a pipeline and an empty inbox. The global average inbox placement rate sits at 83.1% this year, which means roughly 1 in 6 emails you send never reaches its intended recipient. Before a single word of your copy is ever read, your sender reputation, authentication setup, and domain health determine whether your message lands, gets filtered, or disappears entirely.
The numbers are getting harder to ignore. With 376.4 billion emails sent every single day worldwide and nearly 45% of that volume classified as spam, inbox providers have dramatically tightened their filters. Gmail enforced permanent bulk sender classification rules in late 2025. Yahoo and Microsoft followed with stricter authentication requirements. The era of ‘set it and forget it’ email infrastructure is over, and the statistics from 2026 make that clear.
This article compiles the most important email deliverability statistics for 2026, covering inbox placement by ESP and industry, spam data, authentication adoption rates, and the benchmarks that actually matter for cold email senders, SDR teams, and email agencies. Use these numbers to audit your current setup, set realistic performance targets, and understand exactly where your emails are going and why. For a full tactical breakdown, see our complete email deliverability guide.
Table of Contents
What Is the Average Email Deliverability Rate in 2026?
The average email deliverability rate across 15 major ESPs tested in 2026 is 83.1%, according to EmailToolTester’s independent benchmark. That sounds acceptable until you do the math: if you send 10,000 emails, approximately 1,690 of them will never reach the inbox. Of the emails that do leave your server, 10.5% land in the spam folder and another 6.4% go missing altogether and are classified as undelivered.
The benchmark is clear: an inbox placement rate above 89% is considered good, and above 95% is considered excellent. Most senders are operating below both thresholds. If your emails are routinely hitting the spam folder, our guide on how to stop emails going to spam covers the prevention checklist in detail.
What makes this especially alarming is the scale. According to the Radicati Group, 392.5 billion emails will be sent daily by the end of 2026. Running the 16.9% miss rate against that volume means approximately 66 billion legitimate emails fail to reach an inbox every single day. The deliverability problem is not abstract: it is happening at a volume that dwarfs most other marketing channel failures.
Key Global Deliverability Benchmarks at a Glance
| Metric | 2026 Benchmark |
|---|---|
| Average inbox placement rate | 83.1% |
| Emails landing in spam folder | 10.5% |
| Emails never delivered (undelivered) | 6.4% |
| 'Good' deliverability threshold | 89%+ |
| 'Excellent' deliverability threshold | 95%+ |
| Global daily email volume | 376.4 billion |
| Percentage of email that is spam | ~45% |
| Daily spam email volume | ~188 billion |
How Does Email Deliverability Differ Across Major ESPs in 2026?
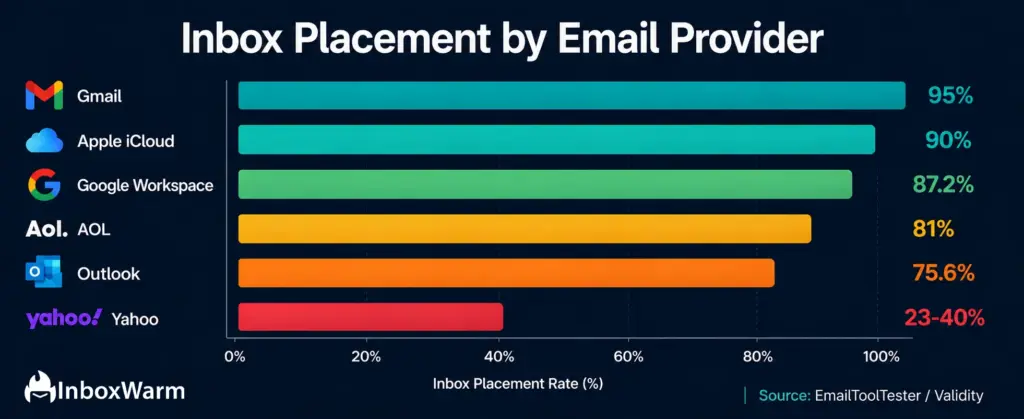
Not all email service providers deliver equally, and the gap between the best and worst performers in 2026 is wider than most senders realize. Gmail continues to lead all major ESPs with approximately 95% inbox placement, while Microsoft Outlook trails at 75.6%, a difference of nearly 20 percentage points that has direct revenue implications for any sender whose list skews toward business recipients.
Yahoo is experiencing serious deliverability challenges in 2026, with some benchmarks placing its inbox rate as low as 23% in certain testing scenarios. That 77-point spread between the highest and lowest performers makes treating deliverability as a single number increasingly meaningless. Where your recipients’ inboxes live matters as much as what you send.
ESP Deliverability Comparison: 2026 Data
| Email Provider | Inbox Placement Rate | Notes |
|---|---|---|
| Gmail (Consumer) | ~95% | Highest among all major ESPs |
| Apple iCloud Mail | ~90% | Strong due to MPP and strict filters |
| Google Workspace | 87.2% | Validity Q1 2026 benchmark |
| AOL | ~81% | Mid-tier, declining engagement filters |
| Microsoft Outlook / 365 | 75.6% | Lowest among big four; Sweep feature impact |
| Yahoo Mail | 23-40% | Volatile; strictest spam filtering in 2026 |
The practical takeaway for cold email senders: if your prospect list is heavy on Outlook and Yahoo domains, you need stricter list hygiene, warmer domains, and more conservative sending volumes. If you want a deeper look at how Gmail’s rules affect your inbox rate, see InboxWarm’s guide to Gmail warm-up. For Outlook-heavy lists, the Outlook warm-up guide covers provider-specific requirements in full.
Is Your Sender Reputation Hurting Your Inbox Rate?
InboxWarm.ai builds and protects your domain reputation with AI-powered warm-up, so your emails land where they belong.
What Are the Email Deliverability Benchmarks by Industry in 2026?
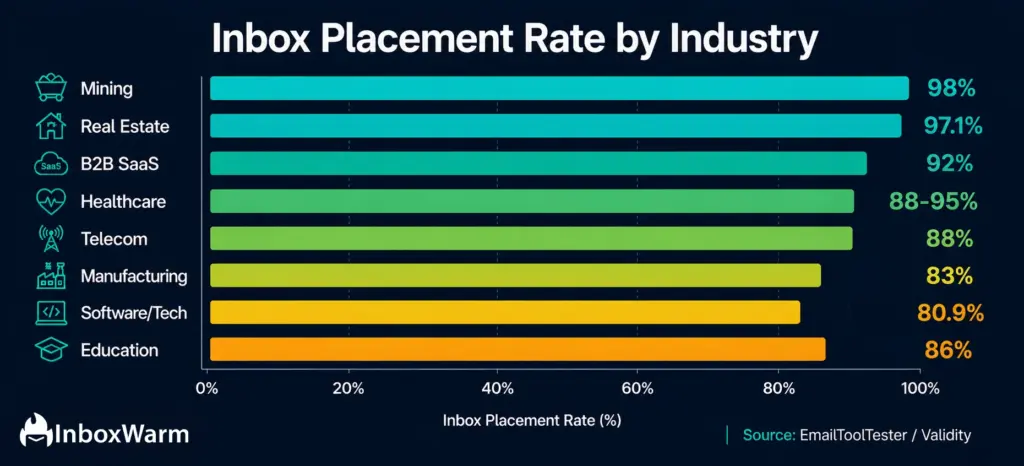
Industry context matters enormously for deliverability benchmarks. According to the 2026 Digital Applied industry benchmark, the median inbox placement rate ranges from 86% at the bottom to 92% at the top, and that 6-point gap translates to millions of missed inbox views annually for high-volume senders. The variation is driven less by mailbox provider preferences and more by structural differences in how each industry builds its lists, how frequently it sends, and what engagement signals it generates.
Industries With the Highest Email Deliverability
B2B SaaS leads all sectors at 92% inbox placement in 2026. The reason: SaaS companies typically use double opt-in, send to engaged decision-makers, and maintain relatively small, high-quality lists. Mining (98%) and healthcare (88-95%) also perform strongly due to high transactional trust signals and low promotional volume. Real estate holds one of the highest rates in some benchmarks at 97.1%, driven by the high engagement intent of recipients actively seeking property information.
Industries With the Lowest Email Deliverability
Software and technology companies average just 80.9% inbox placement according to Validity despite having the best authentication setups. The irony: technical senders know how to configure SPF, DKIM, and DMARC correctly, but their aggressive send volumes, trial-user churn, and high complaint rates undermine those infrastructure gains. Education comes in at the bottom of one major benchmark at 86%, largely because .edu domains often send from shared infrastructure with inconsistent authentication and face endemic list decay from student churn.
| Industry | Avg Inbox Placement | Key Driver |
|---|---|---|
| Mining | 98% | High trust, low volume, transactional content |
| Real Estate | 97.1% | High recipient intent, strong engagement |
| B2B SaaS | 92% | Opt-in lists, engaged decision-makers |
| Healthcare | 88-95% | Regulated, trusted sender category |
| Telecommunications | ~88% | Transactional sends, strong authentication |
| Manufacturing | ~83% | Mixed list quality, moderate volume |
| Software / Tech | 80.9% | High volume, list churn, complaint rates |
| Education | 86% | Shared infra, high student list decay |
What Do the 2026 Spam Statistics Actually Tell Senders?
Spam is not a fringe problem. It is the dominant context your emails are competing inside. Here are the numbers that define the spam landscape in 2026, and what each one means for your sending program.
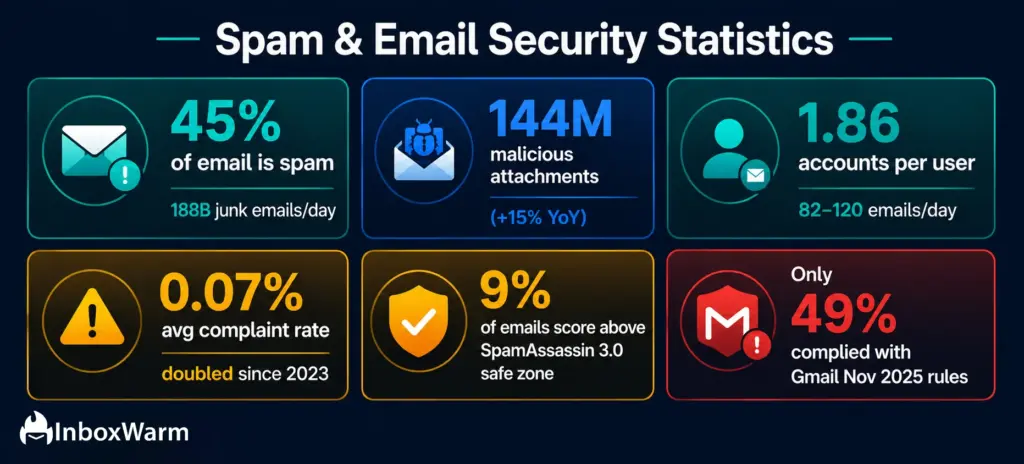
45% of All Global Email Traffic Is Spam in 2026
According to Kaspersky’s 2026 telemetry, nearly half of every email sent worldwide is classified as spam. That translates to approximately 188 billion junk emails delivered every single day. This is the filter environment your legitimate emails are navigating, and it is why inbox providers like Gmail, Outlook, and Yahoo have made their algorithms significantly more aggressive in the past 24 months. Understanding your email spam score before you launch any campaign is no longer optional: it is baseline hygiene.
Users Received 144 Million Malicious Email Attachments in 2025
That figure is up 15% year-over-year, and it is one of the primary reasons inbox providers are increasing the sensitivity of their content filters. The volume of malicious email has trained ISP algorithms to be pattern-aggressive: any content, sending behavior, or domain history that resembles known threat patterns gets filtered regardless of whether your intent is legitimate. This is why even technically clean cold emails from unwarmed domains get caught in spam. The filters are not just blocking obvious threats; they are blocking anything that fits a suspicious pattern.
The Average Recipient Manages 1.86 Email Accounts and Receives 82-120 Emails Per Day
Inbox crowding is at an all-time high in 2026. With recipients managing nearly two accounts each and receiving up to 120 emails daily, engagement thresholds have risen. A recipient who used to open 1 in 5 emails may now only open 1 in 8. Lower engagement rates across the board create a compounding problem: ISPs see declining open and reply rates, interpret that as reduced sender quality, and begin routing more of your mail to spam. This cycle is exactly what email warm-up breaks by establishing positive engagement signals before your cold campaigns begin.
The Average Industry Spam Complaint Rate Doubled in 2024 and Sits at 0.07% in 2026
Validity’s benchmark data shows the average spam complaint rate reached 0.07% across the industry, up from pre-2024 levels. While 0.07% is technically within Gmail’s 0.1% safe threshold, the upward trend is the warning sign. Gmail’s bulk sender enforcement is unforgiving once you cross 0.1%: filtered traffic begins immediately, and you lose access to Gmail’s mitigation support until you sustain sub-0.3% for several consecutive weeks. For cold email senders, the practical target is as close to 0% as possible, not just below the limit.
91% of Emails Score Below 3.0 on SpamAssassin — the 9% Above It Are in Serious Trouble
Unspam.email’s 2026 deliverability benchmark shows that 91% of tested emails score below 3.0 on SpamAssassin, which is the generally accepted safe zone. The 9% that exceed that threshold are at meaningful risk of filtering. Above 5.0 and you are likely landing in spam. Above 10.0 and many providers will block delivery outright. Content quality issues such as excessive links, spam trigger words, broken HTML, and missing List-Unsubscribe headers are responsible for most scores above 3.0, and they are all fixable before you hit send.
Only 49% of Senders Complied With Gmail’s November 2025 Enforcement Rules
A Mailgun survey of 1,100+ senders found that just 49% made the necessary changes after Gmail’s November 2025 escalation, which permanently classifies anyone sending 5,000+ daily emails to personal Gmail accounts as a bulk sender. That means more than half of high-volume senders are currently operating outside Gmail’s compliance requirements, whether they know it or not. Non-compliant senders face temporary rate limiting or permanent rejection codes. If you are unsure whether your setup meets the current requirements, the Google and Yahoo sender requirements checklist covers every mandatory configuration in one place.
Spam Thresholds Every Sender Must Know
| Metric | Safe Zone | Danger Zone |
|---|---|---|
| Gmail spam complaint rate | Below 0.1% | 0.3%+ triggers filtering |
| SpamAssassin score | Below 3.0 (91% of emails pass) | Above 5.0 = likely spam; 10+ = blocked |
| Bounce rate | Below 2% | Above 5% signals list decay |
| Unsubscribe rate | Below 0.5% | Above 1% flags poor list quality |
| Spam folder placement | Below 5% | Above 10% requires immediate intervention |
How Is Email Authentication Adoption Changing?
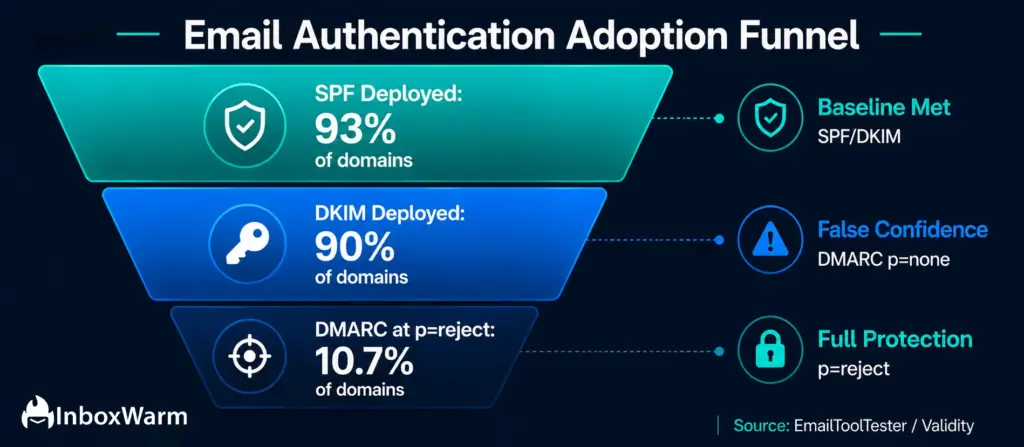
Authentication adoption has improved significantly since Google and Yahoo mandated SPF, DKIM, and DMARC for bulk senders in 2024. SPF is now deployed by 93% of tested domains, and DKIM adoption sits at 90%. But here is the gap that matters: despite widespread SPF and DKIM coverage, the global inbox rate is still only 65% on average in some benchmarks. Authentication is necessary but not sufficient. Use InboxWarm’s free SPF checker, DKIM checker, and DMARC checker to verify your current setup.
DMARC tells the clearest story about the industry’s half-measures approach to email security. A March 2026 snapshot of over 990,000 domains by EasyDMARC found that 70.9% have no effective DMARC protection. Of the domains that do have DMARC records, only 10.7% run full enforcement at p=reject. The vast majority are sitting at p=none, which means they are monitoring for spoofing but not stopping it. If you need help configuring this, use our free DMARC generator to build the correct record for your domain.
| Authentication Protocol | Adoption Rate (2026) | What It Means |
|---|---|---|
| SPF | 93% | Server authorization; baseline requirement met |
| DKIM | 90% | Message signing; widely deployed |
| DMARC (any policy) | 64% | Up from 61% prior year; 36% still unprotected |
| DMARC at p=reject | 10.7% of all domains | Full enforcement; rare despite mandates |
| DMARC at p=none | ~53% of DMARC domains | Monitoring only; no actual protection |
| BIMI (brand indicators) | Early adoption | Requires p=quarantine or p=reject DMARC |
The practical risk: a domain with SPF and DKIM but DMARC at p=none is still spoofable. Malicious actors can send email appearing to come from your domain, and mailbox providers will not reject it. This actively damages your sender reputation through association even when you are sending clean, legitimate email. For a full walkthrough of how these three protocols interact, read our guide to SPF, DKIM, and DMARC explained.
What Do Regional Email Deliverability Differences Look Like in 2026?
Geography matters for inbox placement, and the 2026 data shows meaningful regional variation. Europe continues to outperform the United States, with an average inbox placement rate of 89.1% compared to 85% in the US. The explanation is structural: GDPR enforcement in Europe has produced cleaner, more permission-based email lists, and European senders send lower overall volume to more accurate addresses. For US senders, CAN-SPAM compliance is the legal baseline, but it does not require the same list hygiene discipline that GDPR demands, which shows up directly in deliverability numbers.
The Asia-Pacific region sits at approximately 78% inbox placement, the lowest among major global markets. High email volume, variable authentication adoption across jurisdictions, and fewer standardized anti-spam regulations create a more difficult deliverability environment. For senders with APAC-heavy prospect lists, domain warming and aggressive list hygiene are not optional: they are prerequisites for any meaningful inbox presence.
| Region | Avg Inbox Placement | Primary Driver |
|---|---|---|
| Europe | 89.1% | GDPR-clean lists, lower send volume |
| United States | 85% | High volume, CAN-SPAM, strict filters |
| Canada | ~86% | CASL compliance, mid-volume |
| Asia-Pacific | ~78% | Variable regulation, high volume |
| Latin America | ~80% | LGPD (Brazil) emerging; mixed compliance |
What Role Does Email Warm-Up Play in Deliverability in 2026?
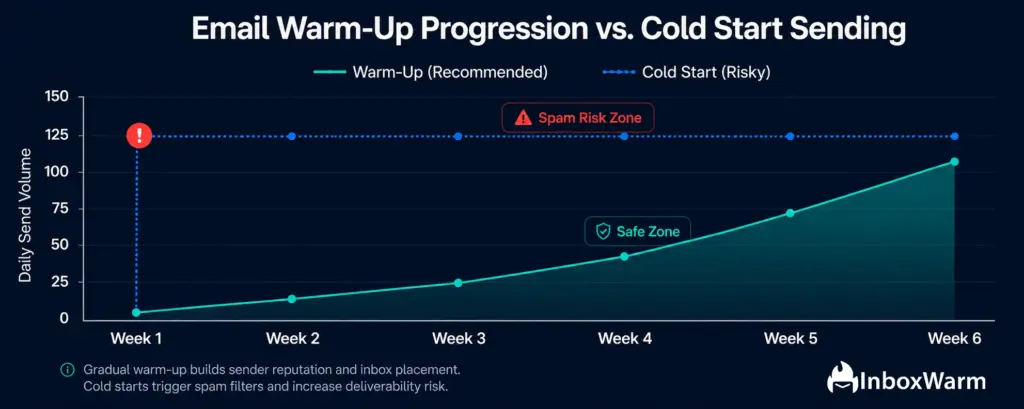
Email warm-up is not a workaround or a growth hack. In 2026, it is a foundational requirement for any sender launching a new domain, scaling volume on an existing one, or recovering from a spam incident or blacklist hit. Inbox providers use historical sending patterns as one of their primary signals for classifying new senders: a domain that goes from zero to 500 emails per day in its first week is almost guaranteed to trigger filters. For SMTP senders specifically, see our complete SMTP server warm-up guide.
The recommended warming timeline in 2026 is 3 to 6 weeks for new domains before launching cold outreach at full volume. During that period, a properly configured warm-up tool generates realistic, AI-driven email conversations between your domain and other warmed domains, building a track record of engagement that inbox providers interpret as legitimate sending behavior. Domains that skip this step and go straight into cold campaigns are the primary reason cold emails go to spam even for senders with correct SPF, DKIM, and DMARC configurations.
The data supports the impact: properly warmed and authenticated domains operating with optimized sending patterns consistently achieve inbox placement rates above 92%, compared to the 83.1% industry average. According to Prospeo’s 2026 benchmark, that 9-point gap represents thousands of additional conversations per campaign for any sender running volume above 5,000 emails per month. If you are evaluating options, our comparison of free email warm-up tools covers what the free tier can and cannot do at scale.
Skip the Spam Folder with AI-Powered Email Warm-Up
InboxWarm.ai automates the warm-up process across all your mailboxes, building the domain reputation your campaigns need before you send a single cold email.
What Are the 2026 Email Deliverability Benchmarks for Cold Email Specifically?
Cold email operates in a different deliverability environment than permission-based marketing email, and the benchmarks reflect that distinction. While opt-in programs running full authentication and engagement-based sending consistently achieve 85 to 95% inbox placement, cold outreach is structurally more volatile, particularly on Microsoft-controlled domains. According to Mailgun’s 2026 deliverability report, only 49% of senders made changes to comply with Gmail’s November 2025 enforcement escalation, which permanently classifies anyone sending 5,000+ daily emails to personal Gmail accounts as a bulk sender.
The average cold email reply rate in 2026 sits at approximately 3.4%, with top-performing senders hitting above 10%. The deliverability lever matters significantly here: teams that maintain bounce rates below 2% and complaint rates near zero see 15 to 25% more replies without changing a single word of their copy. The difference between a working cold email program and a failing one is almost always an infrastructure issue, not a copywriting issue.
Cold Email Deliverability Benchmarks: 2026
| Metric | Benchmark | Action Threshold |
|---|---|---|
| Average cold email reply rate | 3.4% | Below 2% = deliverability review needed |
| Top 10% sender reply rate | 10%+ | Target with clean infra + strong copy |
| Bounce rate (cold campaigns) | Under 2% | Above 5% = immediate list hygiene required |
| Complaint rate | Near 0% | 0.1% = warning; 0.3% = Gmail filtering |
| Inbox placement (cold, fully warmed) | 85-95%+ | Below 80% = warm-up or domain issue |
| Recommended warm-up duration | 3-6 weeks | Before any cold campaign launch |
How Is AI Changing Email Deliverability in 2026?
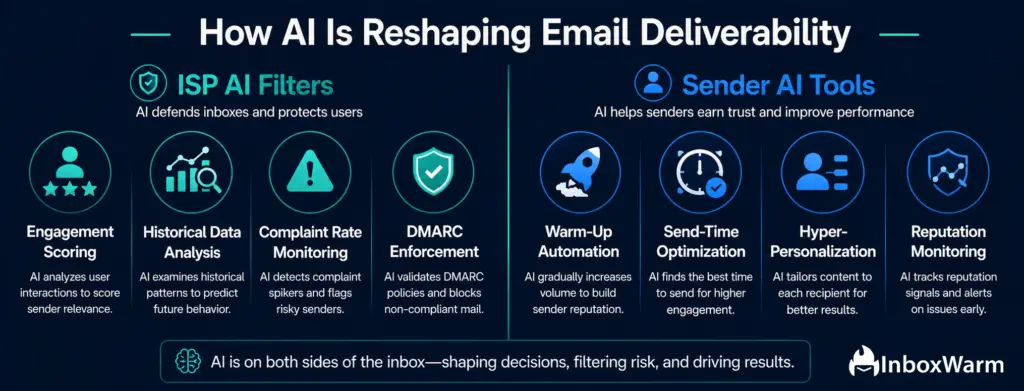
AI is reshaping email deliverability from two directions simultaneously: inbox providers are using it to build smarter, more adaptive spam filters, and senders are using it to optimize sending patterns, personalize content, and monitor reputation signals in real time. Both trends are accelerating in 2026. Almost 90% of marketing professionals expect more than three-quarters of their email operations to be AI-supported by the end of 2026.
On the sender side, 63% of B2B marketers now use AI for writing emails, and AI-generated hyper-personalized emails produce 13.44% higher click-through rates than standard templates. The adoption curve is steep, and tools that combine AI personalization with infrastructure-level deliverability management are pulling ahead of single-function solutions.
On the provider side, AI-driven ISP filtering systems now rely on longer historical data windows than previous rule-based systems. This means reputation recovery after a spam incident or blacklist hit takes weeks to months in 2026, not days. ISPs are also shifting away from IP and domain reputation as the primary signal and toward user engagement as the dominant factor. Monitor your sending reputation in Google Postmaster Tools daily if you are sending at volume: a domain with perfect authentication but low open rates and high complaint rates will underperform a domain with average authentication and strong engagement every single time.
What Should Senders Prioritize Based on These 2026 Statistics?
The 2026 deliverability data points to a clear set of priorities. Authentication alone is not enough: 93% SPF adoption and 90% DKIM adoption have not moved the global inbox rate above 65% on average in some benchmarks. The gap between having authentication and enforcing it, and between sending authenticated email and sending email that generates engagement, is where most deliverability failures live. For agencies managing multiple clients, automated email warm-up is the most scalable way to close that gap across all your mailboxes simultaneously.
The Five Highest-Leverage Deliverability Actions in 2026
- Move DMARC from p=none to p=reject. Only 10.7% of domains have done this. Use InboxWarm’s free DMARC generator to build and deploy the correct record. It is the most underutilized protection in the email ecosystem.
- Warm up every new domain and mailbox before sending cold campaigns. The 3 to 6 week warm-up window is not optional if you want to operate above the 83.1% average. See our SMTP warm-up guide for the full ramp-up schedule.
- Keep bounce rates below 2% and complaint rates below 0.1%. These two metrics are the primary tripwires for Gmail and Yahoo filtering in 2026.
- Segment by engagement and suppress unresponsive contacts. Sending to unengaged lists poisons your sender reputation regardless of how clean your authentication setup is. Our guide on why cold emails go to spam covers the list hygiene piece in full.
- Monitor per-provider inbox placement, not just overall delivery rate. A 90% delivery rate that is 75% Outlook and 15% Yahoo is a very different situation than 90% Gmail placement. Check your email error codes to diagnose provider-specific filtering issues before they compound.
Final Thoughts
The 2026 email deliverability statistics are a clear signal: the infrastructure bar has been raised, and most senders have not cleared it. The 83.1% average inbox placement means nearly 1 in 6 emails fails before anyone sees the subject line. DMARC enforcement sits at just 10.7% despite being the authentication layer that actually stops spoofing and reputation contamination. And Yahoo’s inbox rate of 23 to 40% represents a deliverability crisis for any sender whose list includes a significant share of Yahoo addresses.
What separates the senders consistently above 90% inbox placement from the rest is not better copywriting or smarter targeting. It is cleaner infrastructure: properly enforced authentication, warmed domains, scrubbed lists, and engagement-based sending cadences that give inbox providers the positive signals they need to route email correctly. These are not technical luxuries for large teams. They are the baseline for any sender who wants their emails to actually reach people in 2026.
InboxWarm.ai is built specifically to solve the warm-up and sender reputation piece of this equation. If you are launching a new domain, recovering from a spam incident, or managing deliverability across multiple client mailboxes, the warm-up process is where the work starts. The statistics are clear about what happens to senders who skip it.
Frequently Asked Questions
2. Why Is My Email Going To Spam Even Though I Have Spf And Dkim Set Up?
SPF and DKIM are necessary but not sufficient for inbox placement. ISPs also evaluate DMARC enforcement level, user engagement signals (open rates, clicks, and complaint rates), content quality, and sending pattern consistency. A domain with correct authentication but low engagement or a DMARC policy p=none will still underperform. Email warm-up, list hygiene, and engagement-based sending are the missing pieces most senders overlook.
3. What Is The Gmail Spam Complaint Rate Limit In 2026?
Gmail requires senders to maintain a spam complaint rate below 0.1%. Reaching 0.3% triggers filtered traffic and loss of Gmail mitigation support until you sustain sub-0.3% for several consecutive weeks. Monitor this metric in Google Postmaster Tools daily if you are sending at volume.
4. Which Email Provider Has The Best Deliverability In 2026?
Gmail leads all major providers at approximately 95% inbox placement. Apple iCloud Mail follows at around 90%, and Google Workspace at 87.2%. Microsoft Outlook/365 is significantly lower at 75.6%, and Yahoo is the most problematic at 23 to 40% in some benchmarks. If your prospect list skews toward Outlook and Yahoo domains, more aggressive warm-up and deliverability management is essential.
5. How long does email warm-up take in 2026?
The recommended warming timeline for a new domain in 2026 is 3 to 6 weeks before launching cold outreach at full volume. This timeline builds the engagement history that inbox providers use to classify your domain as a legitimate sender. Skipping or rushing this process is the leading cause of deliverability failures for new cold email campaigns.
6. What Percentage Of Email Is Spam In 2026?
Approximately 45% of all global email traffic in 2026 is classified as spam, representing around 188 billion junk emails sent every single day, according to Kaspersky's 2026 telemetry. Users encountered 144 million malicious email attachments in 2025, up 15% year-over-year.
7. Does DMARC affect email deliverability?
Yes, significantly. DMARC p=reject is required for BIMI adoption and strongly associated with better inbox placement on Gmail. The larger issue is that 70.9% of domains have no effective DMARC protection, and only 10.7% enforce it. p=reject. Running DMARC gives senders false confidence: it monitors spoofing without stopping it, and the resulting association with phishing attempts can damage your domain's reputation over time.
8. What Is The Best Way To Improve Email Deliverability In 2026?
The five highest-leverage actions are moving DMARC to p=reject using InboxWarm's free DMARC generator; warming up every new domain for 3 to 6 weeks before cold campaigns; maintaining bounce rates below 2% and complaint rates below 0.1%; suppressing unengaged contacts from active sends; and monitoring inbox placement by provider rather than relying on overall delivery rate as a health indicator.
Your Emails Deserve to Reach the Inbox
InboxWarm.ai uses AI-powered warm-up to build your sender reputation from day one, so your cold campaigns start with infrastructure that performs above the industry average.